Introduction
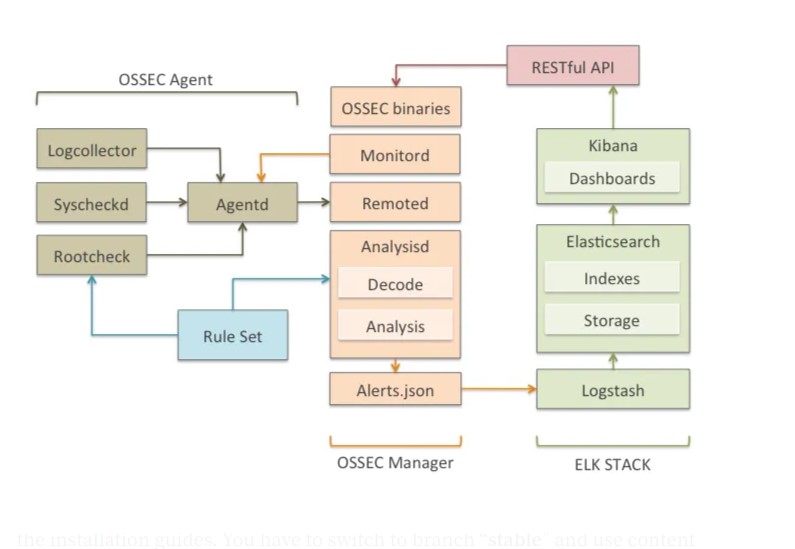
ELK is a software stack that provides a platform for log management and analysis. It consists of several open-source tools including Elasticsearch, Logstash, and Kibana. ELK is widely used for security monitoring and threat detection due to its ability to process and analyze large volumes of data in real-time.
Setting up a Wazuh manager with ELK adds value to the platform by providing additional security features such as intrusion detection and endpoint security monitoring. Wazuh is an open-source security platform that can be integrated with ELK to provide a more comprehensive security solution.
By combining the power of ELK with the security capabilities of Wazuh, organizations can enhance their security posture and better protect their systems and data from threats. In this walkthrough, we will guide you through the process of setting up an ELK/Wazuh manager to help you get started with security monitoring.
Methodology
Setting up ELK and Wazuh Manager
- Install Ubuntu Server on a dedicated machine that will act as the ELK and Wazuh manager.
- Install Elasticsearch, Logstash, and Kibana by following the instructions provided.
- Install and configure Wazuh by following the instructions provided by Wazuh.
- Integrate Wazuh with ELK by installing the Wazuh app for Kibana.
Installing Wazuh Agents on Endpoints
- Install the Wazuh agent package on each endpoint that you want to monitor.
- Configure the Wazuh agent to communicate with the Wazuh manager by providing the IP address of the Wazuh manager during installation.
- Verify that the Wazuh agent is communicating with the Wazuh manager by checking the Wazuh manager’s logs.
- Configure the Wazuh agent to monitor the desired logs and system events by editing the agent’s configuration file.
- Verify that the Wazuh agent is sending events to the Wazuh manager by checking the Wazuh manager’s logs.
By following these steps, you can set up an ELK and Wazuh manager on Ubuntu Server and install Wazuh agents on endpoints for comprehensive security monitoring.
Setting up ELK and Wazuh Manager
Prerequisites
-
Download and install Ubuntu Server 22.04.2 from https://ubuntu.com/download/server#downloads (used in this Walkthrough) and allocate a minimum of 4GB RAM, 100 GB storage and 2 CPUs. A detailed step-by-step process has been outlined here.
-
Download and install Windows 10 machine to act as the Victim PC as well as the monitoring PC.
All-in-one Deployment
This outlines installation of the Wazuh server and Elastic Stack components in an all-in-one configuration. For successful deployment, all commands must be run with root user privileges
Installing and Configuring Elasticsearch
-
curl -s https://artifacts.elastic.co/GPG-KEY-elasticsearch | gpg --no-default-keyring --keyring gnupg-ring:/usr/share/keyrings/elasticsearch.gpg --import && chmod 644 /usr/share/keyrings/elasticsearch.gpg -
echo "deb [signed-by=/usr/share/keyrings/elasticsearch.gpg] https://artifacts.elastic.co/packages/7.x/apt stable main" | tee /etc/apt/sources.list.d/elastic-7.x.list -
apt-get update -
apt-get install elasticsearch=7.17.9 -
curl -so /etc/elasticsearch/elasticsearch.yml https://packages.wazuh.com/4.4/tpl/elastic-basic/elasticsearch_all_in_one.yml -
Since Elasticsearch will require certificates and keys to communicate with the Elasticsearch node using SSL, download the config files for the certs and generate the certificates using the commands below:
curl -so /usr/share/elasticsearch/instances.yml https://packages.wazuh.com/4.4/tpl/elastic-basic/instances_aio.yml/usr/share/elasticsearch/bin/elasticsearch-certutil cert ca --pem --in instances.yml --keep-ca-key --out ~/certs.zipunzip ~/certs.zip -d ~/certsmkdir /etc/elasticsearch/certs/ca -p
cp -R ~/certs/ca/ ~/certs/elasticsearch/* /etc/elasticsearch/certs/chown -R elasticsearch: /etc/elasticsearch/certschmod -R 500 /etc/elasticsearch/certschmod 400 /etc/elasticsearch/certs/ca/ca.* /etc/elasticsearch/certs/elasticsearch.*rm -rf ~/certs/ ~/certs.zip -
Enable and start the Elasticsearch service:
systemctl daemon-reloadsystemctl enable elasticsearchsystemctl start elasticsearch -
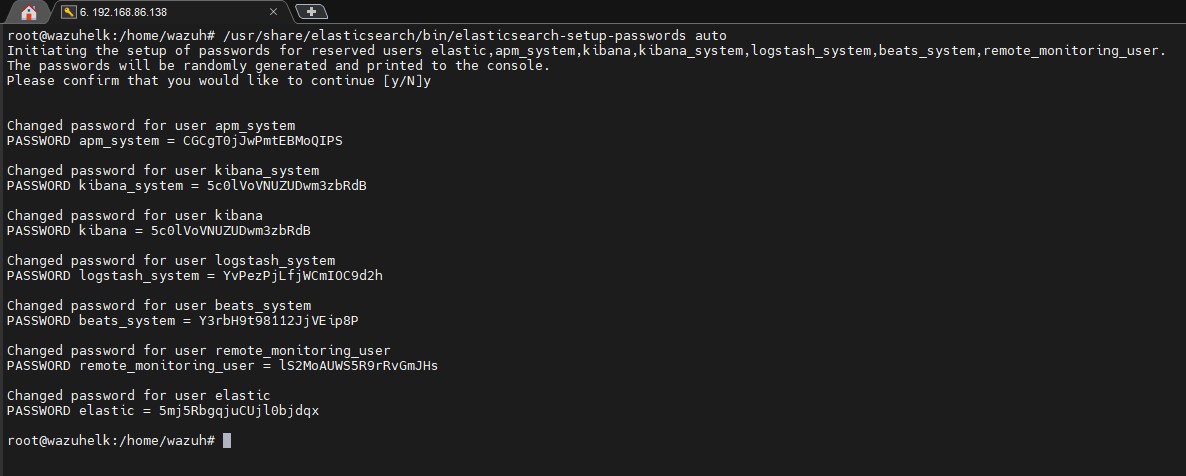
Generate credentials for the Elastic stack pre-built roles and users with the command
/usr/share/elasticsearch/bin/elasticsearch-setup-passwords autoand save the passwords on a text file
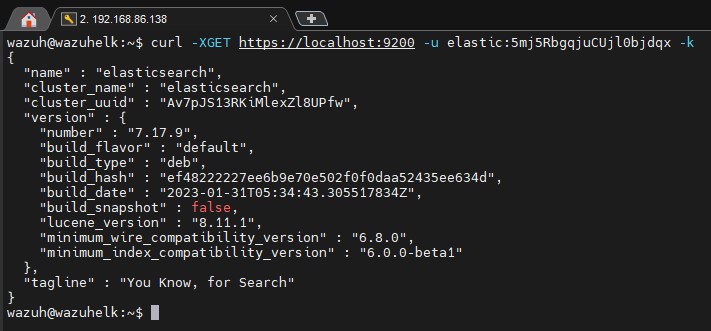
- Confirm Elasticsearch status by using the command curl -XGET https://localhost:9200 -u elastic:<elastic_password> -k and using the elastic password generated earlier to get an output as shown below
Installing Wazuh Server
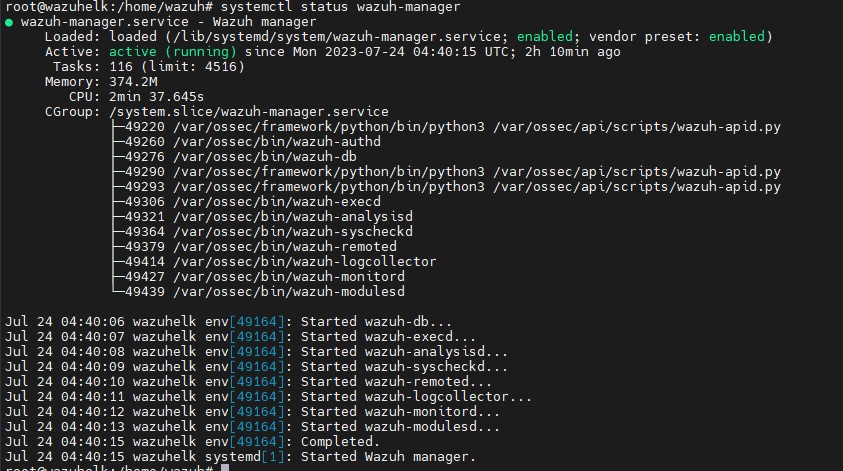
curl -s https://packages.wazuh.com/key/GPG-KEY-WAZUH | gpg --no-default-keyring --keyring gnupg-ring:/usr/share/keyrings/wazuh.gpg --import && chmod 644 /usr/share/keyrings/wazuh.gpgecho "deb [signed-by=/usr/share/keyrings/wazuh.gpg] https://packages.wazuh.com/4.x/apt/ stable main" | tee -a /etc/apt/sources.list.d/wazuh.listapt-get updateapt-get install wazuh-managersystemctl daemon-reloadsystemctl enable wazuh-managersystemctl start wazuh-managersystemctl status wazuh-manager- The output should be similar to the one below
Installing Filebeat
apt-get install filebeat=7.17.9curl -so /etc/filebeat/filebeat.yml https://packages.wazuh.com/4.4/tpl/elastic-basic/filebeat_all_in_one.yml- this is the pre-configured Filebeat config file used to forward Wazuh alerts to Elasticsearch- Download the alert templates for Elasticsearch with ```curl -so /etc/filebeat/wazuh-template.json https://raw.githubusercontent.com/wazuh/wazuh/4.4/extensions/elasticsearch/7.x/wazuh-template.json chmod go+r /etc/filebeat/wazuh-template.json`
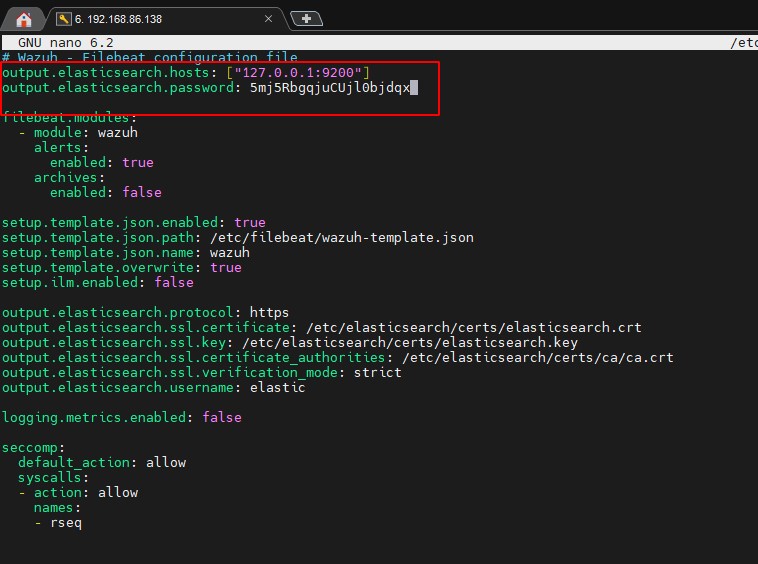
curl -s https://packages.wazuh.com/4.x/filebeat/wazuh-filebeat-0.2.tar.gz | tar -xvz -C /usr/share/filebeat/module- the Wazuh module for Filebeat- Edit the
/etc/filebeat/filebeat.ymlfile and add the elastic password as shown below
- Use these commands to copy the certificates into
/etc/filebeat/certs/
cp -r /etc/elasticsearch/certs/ca/ /etc/filebeat/certs/
cp /etc/elasticsearch/certs/elasticsearch.crt /etc/filebeat/certs/filebeat.crt
cp /etc/elasticsearch/certs/elasticsearch.key /etc/filebeat/certs/filebeat.key
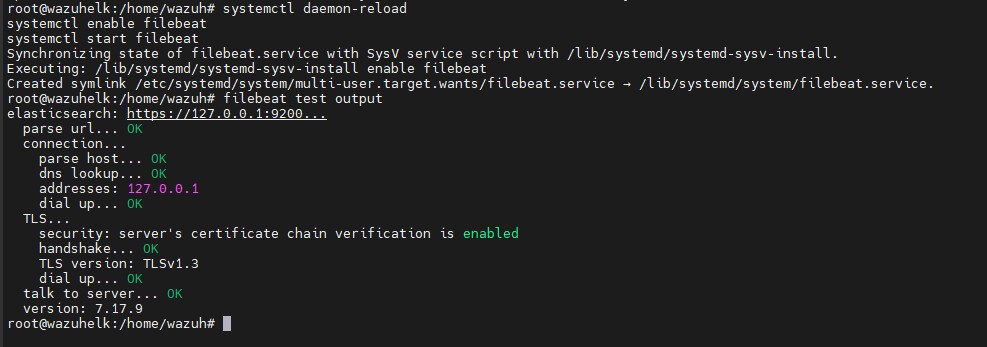
- Enable, start and test Filebeat with these commands which should give an output as shown:
systemctl daemon-reload
systemctl enable filebeat
systemctl start filebeat
filebeat test output
Kibana Installation and configuration
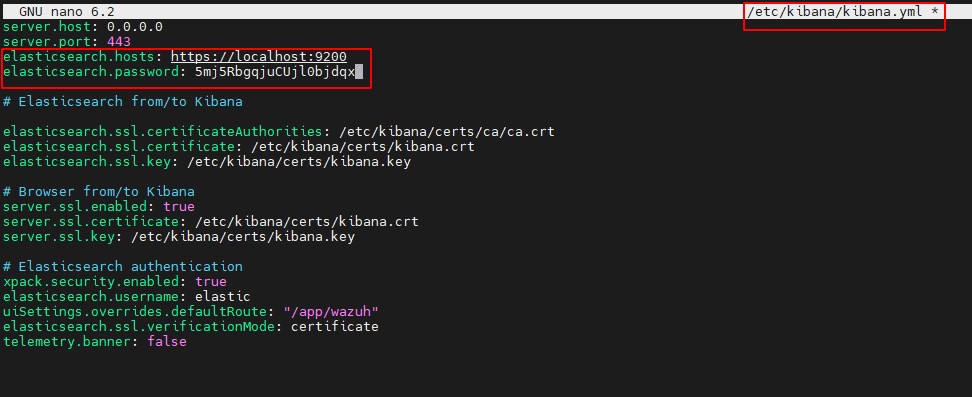
apt-get install kibana=7.17.9mkdir /etc/kibana/certs/ca -pcp -R /etc/elasticsearch/certs/ca/ /etc/kibana/certs/cp /etc/elasticsearch/certs/elasticsearch.key /etc/kibana/certs/kibana.keycp /etc/elasticsearch/certs/elasticsearch.crt /etc/kibana/certs/kibana.crtchown -R kibana:kibana /etc/kibana/chmod -R 500 /etc/kibana/certschmod 440 /etc/kibana/certs/ca/ca.* /etc/kibana/certs/kibana.*curl -so /etc/kibana/kibana.yml https://packages.wazuh.com/4.4/tpl/elastic-basic/kibana_all_in_one.yml- Edit the
/etc/kibana/kibana.ymland add the elastic password
- Create a data directory for Kibana in /usr/share/kibana, install the Wazuh Kibana plugin and link Kibana’s socket to privileged port 443:
mkdir /usr/share/kibana/data
chown -R kibana:kibana /usr/share/kibana
cd /usr/share/kibana
sudo -u kibana /usr/share/kibana/bin/kibana-plugin install https://packages.wazuh.com/4.x/ui/kibana/wazuh_kibana-4.4.5_7.17.9-1.zip
setcap 'cap_net_bind_service=+ep' /usr/share/kibana/node/bin/node
- Enable and start the Kibana service:
systemctl daemon-reload
systemctl enable kibana
systemctl start kibana
Accessing the web interface
Access the web interface using the password generated during the Elasticsearch installation process:
URL: https://<wazuh_server_ip>
user: elastic
password: <PASSWORD_elastic>
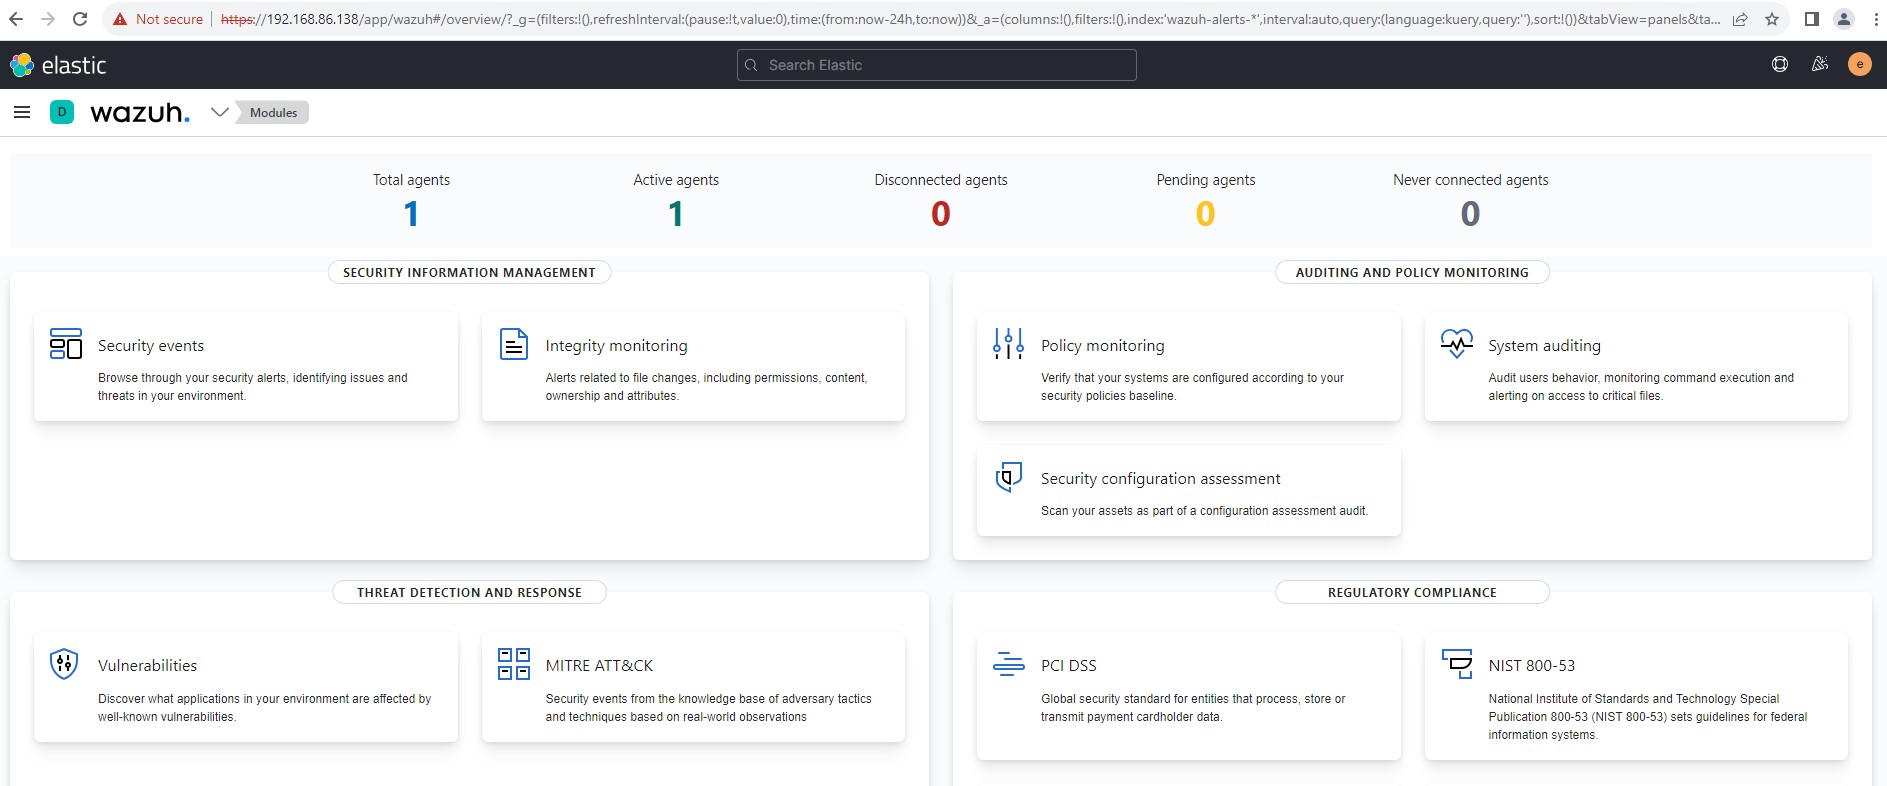
For this guide, we are assuming a 64-bit architecture. You can change the Elastic password on the web interface.
Enrolling Wazuh Agents
On the Windows machine;
- Download and install the Wazuh Agent executable file from here
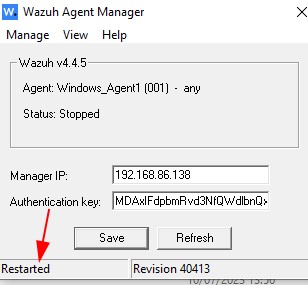
- After installation, a GUI will appear on your screen which will be used to configure the Manager IP. Input the manager IP and restart the agent manager.
Installation & Configuration of Sysmon
System Monitor (Sysmon) is a Windows system service that monitors and logs system activities to the Windows event log. It provides detailed information about process creations, network connections, and changes to file creation time. In doing so, it can be incorporated with Wazuh agents to send comprehensive logs which assists an analyst identify malicious or anomalous activity.
- Download Sysmon here
- Download the configuration file here and save it as config.xml
- Save the config file in the extracted folder containing sysmon executable files
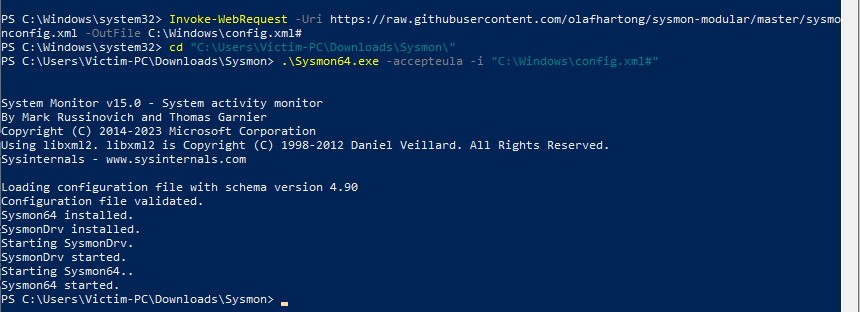
- Run the command
sysmon64.exe -accepteula -i config.xml
- Using an administrator account, modify the Wazuh agent configuration file
ossec.confin the installation directoryC:\Program Files (x86)\ossec-agent\ossec.conf
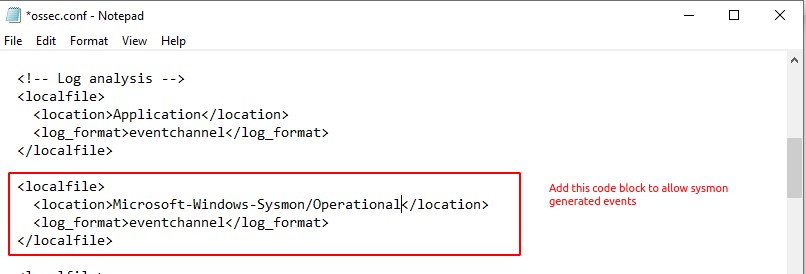
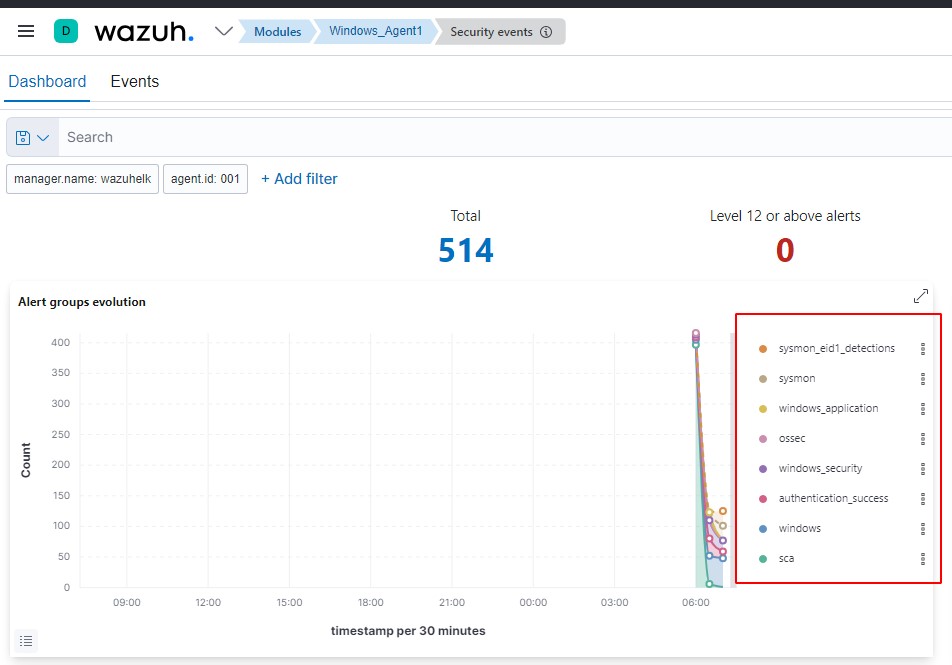
- Restart the agent to effect the changes. Sysmon logs should start streaming in on the manager dashboard.
Thanks for reading and happy learning!